GeoScanners Product Details of GPRSoftware Solutions
GPRSoft® Post processing software for Ground Penetrating Radar data files. Accepts data files from all major GPR manufacturers. Extensive set of tools combined with an extremely user friendly interface. GPRSoft is the affordable and user friendly solution for displaying, post-processing and interpretating ground penetrating radar data. The software has been divided into logical complexity levels to deliver the required processing functions depending on the demands of the applications. Independently of the kind of user, GPRSoft can deliver the needed tools with the shortest possible learning curve. The modern user interface and the 100% compliance with Windows® guidelines for human interfaces guarantees a safe and easy work that focus on the task and not on the used tools. Unlike other software tools on the market, GPRSoft provides a true integration of GPS data positions with the GPR data files. This integration is done seamlessly and reflects the Geoscanners experience in the field. GPRSoft has full support for data files from all the major ground penetrating radar manufacturers, new ones are added and old ones are revised constantly to comply with newer modifications or add ons. View the data the way you like
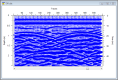
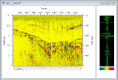
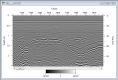
GPRSoft presents the data files the way you want them to be. The software offers full flexibility to present the data in wiggle trace; choose the separation, amplitude and filling you feel comfortable with. If the A and B scan view are desirable then one can fully customize the way they look, palette creation tools and full control over the scales are available to help you to accomplish that. For presentations or publishing your data a B scan only view is provided with full customization as well. Full support for data file from major GPR manufacturersOpening a file in GPRSoft is as easy as opening a file in any application for Microsoft Windows®. The data files are loaded and all current modifications are made on a virtual copy of the original file. This alone is a big advantage over other manufacturers of GPR software forcing you to modify your original file every time a process is made. That means one can open the original file twice and set them side by side for an easy comparison of the processing while it is taking place. Beyond that, GPRSoft has a unique capability of allowing you to undo or redo all the processing history to give you the flexibility you need to test different post processing strategies. Supported file formats: Many DSP tools at your finger tips
GPRSoft standard edition has more than a dozen automatic and semiautomatic DSP tools to help you interpret the ground penetrating data. Different kind of filters with extremely easy user interface are included, gain functions, correction functions and many more are available as well. One of the unique features of GPRSoft software package is that all this DSP tools can be repeated several times in any order you want to obtain the cleanest data possible. That combined with the undo and redo function can give you a degree of freedom not seen before in other similar software packages. Publishing your work
The capabilities of GPRSoft are not limited to processing the data in a flawless manner, but also in providing you with a great deal of flexibility to publish your data. Functions such as zooming with automatic adjusted scales and direct PDF export will certainly come handy when the time comes to present the survey to your customers. The way these publishing tools work is straight forward and gives the user a truly WYSIWYG interface for publishing the work. For instance the color of the scales in the data to be printed will be the same as in the printout. One important facet of this is that the software does not take "screen dumps" of the data windows, but recreates a new printout based on the selected preferences. GPRSoft® Standard Edition and Professional Edition Comparative List of Features GPRSoft Version Feature Matrix
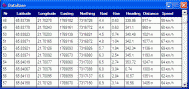
GeoPointer X© GIS package for Ground Penetrating Radar applications. Combines the geolocation data obtained from a GPS receiver with the data obtained by the radar system. Accepts geolocation data produced by other software packages or hardware. One application - many opportunities
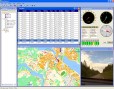
GeoPointer X© serves the needs of a wide audience of users, from construction companies to geophysical consultants. A unique feature of this software is that it combines in one single system the many aspects of a survey, the coordinates coming from the GPS receiver, the positions on the map, pictures of the surroundings and many other useful information. For instance, it is possible to use GeoPointer X© to inspect roads, street lights or any other of the infrastructure objects. The end user has multiple choices to control the software. All the data is stored in one single database and that makes the post processing of the acquired information a more simple and harmonic task. An easy choice but, no compromises
While using GeoPointer X© it is possible to choose which of the data windows you need to display. One can have all data windows open or only a few of them, this will not be reflected in the amount of data collected or the quality of it. The only window that demands to be open, in order to store the data, is the photo data view. On both sides of the surface!
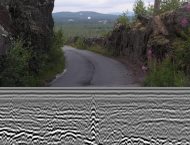
GeoPointer X© brings new possibilities to the way geophysical data is analyzed, not only the data from the geophysical instrument is available but also a whole set of data about the survey location. Using GeoPointer X© together with our triggering devices gives a real possibility of linking the ground penetrating radar data with a database describing the site where the data has been collected. In other words, combining the geophysical survey data and the data stored in GeoPointer X© it is feasible to see both sides of the surface. The post analysis of the data will reveal the features available under the surface together with a picture of the surroundings above the surface. This linked data give us a a better idea of the survey site and its position. This information can be used while writing reports or detailed descriptions of a site. Simple peripherals
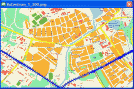
GeoPointer X© does not require special GPS receivers or cameras, quite good results are accomplished with the aid of relative inexpensive equipment. We used the software with different kind of GPS receivers, Bluetooth®, RS232 and USB ones. The only requirement to the GPS receiver is that it has to output NMEA 0183 sentences. We tested different web-cameras, from very inexpensive models to a little bit more sophisticated ones. We reached the conclusion that all depends on the amount of light that reaches the camera lenses, with daylight and no direct sunlight reaching the lenses almost all cameras gave acceptable results. During nightfall or under very bright conditions, we were able to get good results only using a web-camera SPC900/NC from Philips. No complicated local mapsGeoPointer X© does not require expensive maps formatted in some specific way. The maps can be digital ones or even scanned images from paper maps. The only requirement to the map you are planning to use is that at least two exact coordinates must be known on it. The software can use maps of different sizes and resolutions. GeoPointer X© selects from all the available maps the one that suits best the coordinates coming from the GPS receiver. This function can be switched off if the user wants to do so.GeoPointer X© will load automatically a new map from all the available ones every time the coordinates coming from the GPS receiver go out of the boundaries of the currently displayed map.
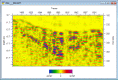
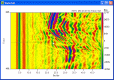
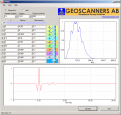
GaiaSpectrum®Data analyzer for different kind of geophysical data files including, but not limited to, Seismic Data files, Ground Penetrating Data files, Mathlab formatted data and many more. Displays the data in five different domains. GaiaSpectrum® is a compact yet powerful set of tools for analyzing and comparing geophysical data collected from different instruments from the same or different manufacturers. It is designed to import all major GPR(Ground Penetrating Radar) file formats, geophysical data formats such as SEG-Y, SEG-2 and a wide variety of laboratory instruments. The data can be viewed in five different ways and there are several tools for automatic and semi-automatic analysis of the data sets. The source data is imported into the software without making any modifications to the original file. The analysis results can be them stored as reference files for further comparison with other data files. GaiaSpectrum® has full support for viewing multiple traces without compression and playing back them in a continuous manner. One can pause, play forward or in reverse the imported file without any restrictions of file size or type. Five Data Views
GaiaSpectrum® has five different data views,four of which can be viewed simultaneously. That is, the imported data can be represented in five different ways: time domain or oscilloscope, frequency domain or spectrum, waterfall view from the time or frequency domains and as phase information against frequency content. The waterfall data view is shared between the frequency and time domain and that's the reason why only four data views are available at the time. Twelve Fully Supported Geophysical Formats and GrowingImporting a file into
GaiaSpectrum® is as easy as opening a file in any
application for Microsoft Windows®. The equipment manufacturer
usually provides fixed values for the most important file
parameters. GaiaSpectrum®
recognizes all the required parameters on the supported files
formats and sets up the options accordingly. After the import is
completed the spectrum view opens showing the spectrum of the
imported file. Supported file formats: Several Automatic And Semiautomatic Analysis Tools
GaiaSpectrum® counts more than a dozen automatic and semiautomatic analysis tools in its standard configuration. Measurements such as: total harmonic distortion, signal to noise ratio, ground penetrating radar filter boundaries selection and many others are quick accurate and easy to use. From version 2.0 and up DSP techniques such as whitening of the spectrum, FFT filters and gaining the input data, have become available. Documenting And Sharing Made Easy
It is possible to save the active data view as a bmp or jpg file to add to reports and any kind of documentation. Labels can be easily added to the data view with different fonts and colors. All data views except the waterfall data view have reference data meaning that a file can be save and sent to your colleague as a reference file. In such a way both of you will see the same results and comparing data becomes easy and reliable.
GaiaSpectrum® Standard Edition List of Features1.Time and frequency domain analysis.
GPRSim.net©Post processing software for Ground Penetrating Radar data files. Accepts data files from all major GPR manufacturers. Extensive set of tools combined with an extremely user friendly interface Simulate, compare and pick the right tools for the job!
GPRSim.net is a
basic GPR time domain simulation tool. It is partially based in the
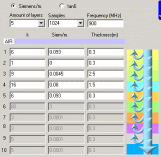
transmission line model and allows up to ten layers to be simulated
with frequencies ranging from 200 to 2000 MHz. It can be used to try
out different real world survey scenarios and understand how
different center frequency antennas could perform, as well as
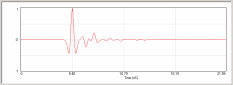
getting an idea of how the A-scan might look like in the given
conditions.
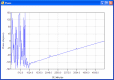
All layers are defined using only three parameters: relative dielectric constant or permittivity (epsilon), electric conductivity (sigma) and the physical thickness of the layer. Instead of the electric conductivity (sigma) it is possible to enter the value for the loss tangent. The model assumes the relative permeability is equal to one. The results of the simulation are displayed in the time and frequency domains and it is possible to print out the time domain plot. Different survey scenarios can be stored as CSV files for quick access.
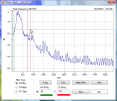
Both the time and frequency domain have cursors for a comfortable interpretation of the results. It is possible in such a way to calculate propagation delays through different medias. GPRSim.net shows in a simple way the attenuation effects of the media at different frequencies and the possible phase shifts of the excitation signal while propagating through it. GPRSim.net can serve as a tool for teaching basic concepts of electromagnetic wave propagation in different medias. It is also very well fitted to explain to customers the always around questions: How deep? How small object?. Showing different scenarios with different frequencies one can in a simple and very didactic way show that it all depends on many factors.
|
|||||||||||||||||||||||||||||||||||||||||||||||||||||||||||||||||||||||||||||||||||||||||||||||||||||||||||||||||||||||||||||||||